Περιγραφή
Its like WordPress Elementor Charts on STEROIDS* 💊
Creating WordPress Charts and Graphs is hard and boring. We make it a whole lot EASIER, QUICKER, more POWERFUL, and more FUN.
With the most ruthlessly effective Charts & Graphs plugin for rapidly implementing data visualization in WordPress like no other.
Graphina introducing Graphina – Divi Charts and Graphs for Divi page builder.
DEMO | PRO | GUTENBERG | Firebase Addon | Forminator Addon | DOCS | Videos
👋 Welcome to the most powerful charting solution that ever existed on WordPress – Graphina.
It’s just magical for implementing data visualization in your Elementor websites. It is a versatile WordPress plugin that allows you to create 14+ graphs and charts with over 1000+ variations. Build on the popular Apex charts, Graphina has a ton of options, wide range of charts and adaptability.
Its AJAX data loading makes sure that your site speed is not hampered. and I know thats important! isn’t it ?
And Did I say “Dynamic Charts”? Yes with PRO version you can simply take charting experience to whole new level. Stay tunned!
Check these unbelievably immersive pages built with Graphina. 😲
A quick tour of Graphina
IMP : ELEMENTOR IS REQUIRED FOR THIS PLUGIN.
15+ Ruthlessly Powerful Charts & Data visualization elements. 💪
- Line Chart Amazingly unique 5+ style of Line charts.
- Column/Bar Chart Easiest and most versatile bar charts.
- Nested Column Chart Advanced bar chart to easily show nested data.
- Area Chart Most Popular chart show overall trends in data.
- Pie Chart Include Pie chart on your site with just few clicks.
- Donut Chart Represent the proportional data or relative data.
- Candle Chart Show trading data like stocks, cryptocurrencies.
- Radar Chart Display data across multiple unique dimensions.
- Radial Chart Create highly customizable radial charts.
- Bubble Chart Visualize relationships between Multiple variables.
- Polar Chart Show scientific & research data in easily.
- Heatmap Chart Visualize the volume of data within a dataset.
- Timeline Chart Great tool to vizualize progression over time.
- Mix Chart Get power to show multiple chart type in one.
- Data Tables Most traditional and effective way to show data.
- Counters Highlight your key metrics with our counters.
- Jquery Datatable Most traditional and effective way to show data.
- Distributed Chart Easiest and most versatile Distributed charts.
- Brush Chart Easiest and most versatile Brush charts.
- Scatter Chart Easiest and most versatile Scatter charts.
GOOGLE CHARTS (New)
- Google Line Chart
- Google Column Chart
- Google Pie Chart
- Google Area Chart
- Google Bar Chart
- Google Donut Chart
- Google Geo Chart
- Google Guage Chart
- Google Org Chart
- Google Gantt Chart
Turn your PICASSO Mode ON with 100s of Customization options.
Who said we devs are not artists? Whith these options anyone can paint a masterpiece.
- Set Custom Color for Charts
- 3 Type of chart fill setting – classic, gradient and pattern
- Customize Chart Cards
- Multiple Chart Legend Positioning
- Chart datalabel Settings
- XY Axis settings
- Mutliple Y-axis title option
- Marker Style Settings
- Chart Drop Shadow Settings
- Chart Background Color Settings
- Prefix and postfix in x-axis/yaxis label and in datalabel
- Optional Commas seperator ( 1000 => 1,000)
- Format Number to String ( Convert 1,000 => 1k and 1,000,000)
- Dynamic Change Chart Type (Example Line-> to Area or Column)
- Stacked line (Area, Line)
- Series Value in Legend
- Large String in Categories
- Chart Admin Setting Page
- Realtime change chart type for same data
PRO Features- When we say POWERFUL, we literaly mean it.
- Dynamic charts with data from GOOGLE SHEETS
- Create charts from LOCAL & REMOTE CSV
- Create charts from APIs
- Create charts from FIREBASE
- Create charts from SQL Queries to Database
- AJAX based auto reloading of data from source
- User ID based data from API and SQL query
- Password Protect your charts. Demo
- Role based view restriction options
- User Id based view restriction options
- Export Chart data to PNG, SVG, CSV
- Realtime change chart type for same data
- Exclusive Scatter chart
- Conditional Colors for Counters
- Chart Filter in API and SQL Builder Dynamic Option
- External mysql database connectivity
- Dynamic Key in API and SQL Builder Dynamic Option (Example https://apps.iqonic.design/docs/product/graphina-elementor-charts-and-graphs/use-dynamic-data-in-widgets/dynamic_key/)
- Create charts from Column wise csv/remote-csv/googlesheet (select specific column for x/y-axis of chart from csv/remote-csv/googlesheet file)
- Create charts from any data source using graphina filters( https://apps.iqonic.design/docs/product/graphina-elementor-charts-and-graphs/use-dynamic-data-in-widgets/data-from-wordpress-filter/)
Check our all Tutorial videos on Youtube –> CLICK HERE
Graphina has extremely intuitive settings that creating a chart is almost like a childplay. All you need is to add your data points, adjust the grid display, and change the colors, fonts, paddings, and margins for elements as per your preference. And yes all this can be configured directly from the Elementor’s interface and does not require any additional code knowledge. Isn’t that genius?
Graphina for Elementor is brilliantly compatible with all modern browsers like Chrome, Firefox, Opera, Safari, or Edge. Your website will look great on all devices and in all browsers.
With PRO version you get the powers to create DYNAMIC Charts like a GOD! 💪
And did I say its RISK FREE ? 😃
I am so confident about Graphina PRO’s benefits that once you try it there is no looking back. Just in case it doesn’t fit your needs then we offer 60 DAYS MONEY BACK GUARANTEE. (Yes that’s for real!!)
Check these quick links to Graphina Family Products
FEEDBACK
Submit a feature request HERE. and sssshhh!! we listen very carefully!
YOU ARE IN GOOD COMPANY
Graphina is crafted by team IQONIC – expert, young, & dynamic creators of community focused digital products and trusted by over 100K individuals and businesses.
DOCUMENTATION AND SUPPORT
- Check our online Documentation HERE .
- For our PRO version owners our experts provide support via https://iqonic.desky.support portal.
HOLD ON THERE TIGER,…NOT SO FAST. WE HAVE MORE FREE STUFF.
We simply love our community and we can’t stop ourselves from creating great products for you. Don’t miss to check these. I promise you’ll be amazed
👉 MARVY – Coolest background animations for Elementor page builder.
👉 Kivicare – One and only Medical EHR solution on WordPress. Built with by VUE JS and Experience is like pure MAGIC. Do try it out.
👉 WP Roadmap – Create product roadmap and feedback board with ease.
👉 JOIN THE COMMUNITY
Did you check these 100+ mind blowing free for community products.Be an exclusive part of the community and level up your digital game.
JOIN NOW
Say Hi on SOCIAL MEDIA
Στιγμιότυπα
The Ultimate buffet of charts and graphs 
Animated Radial Chart Demo 
Column Chart Demo 
Line Chart Demo 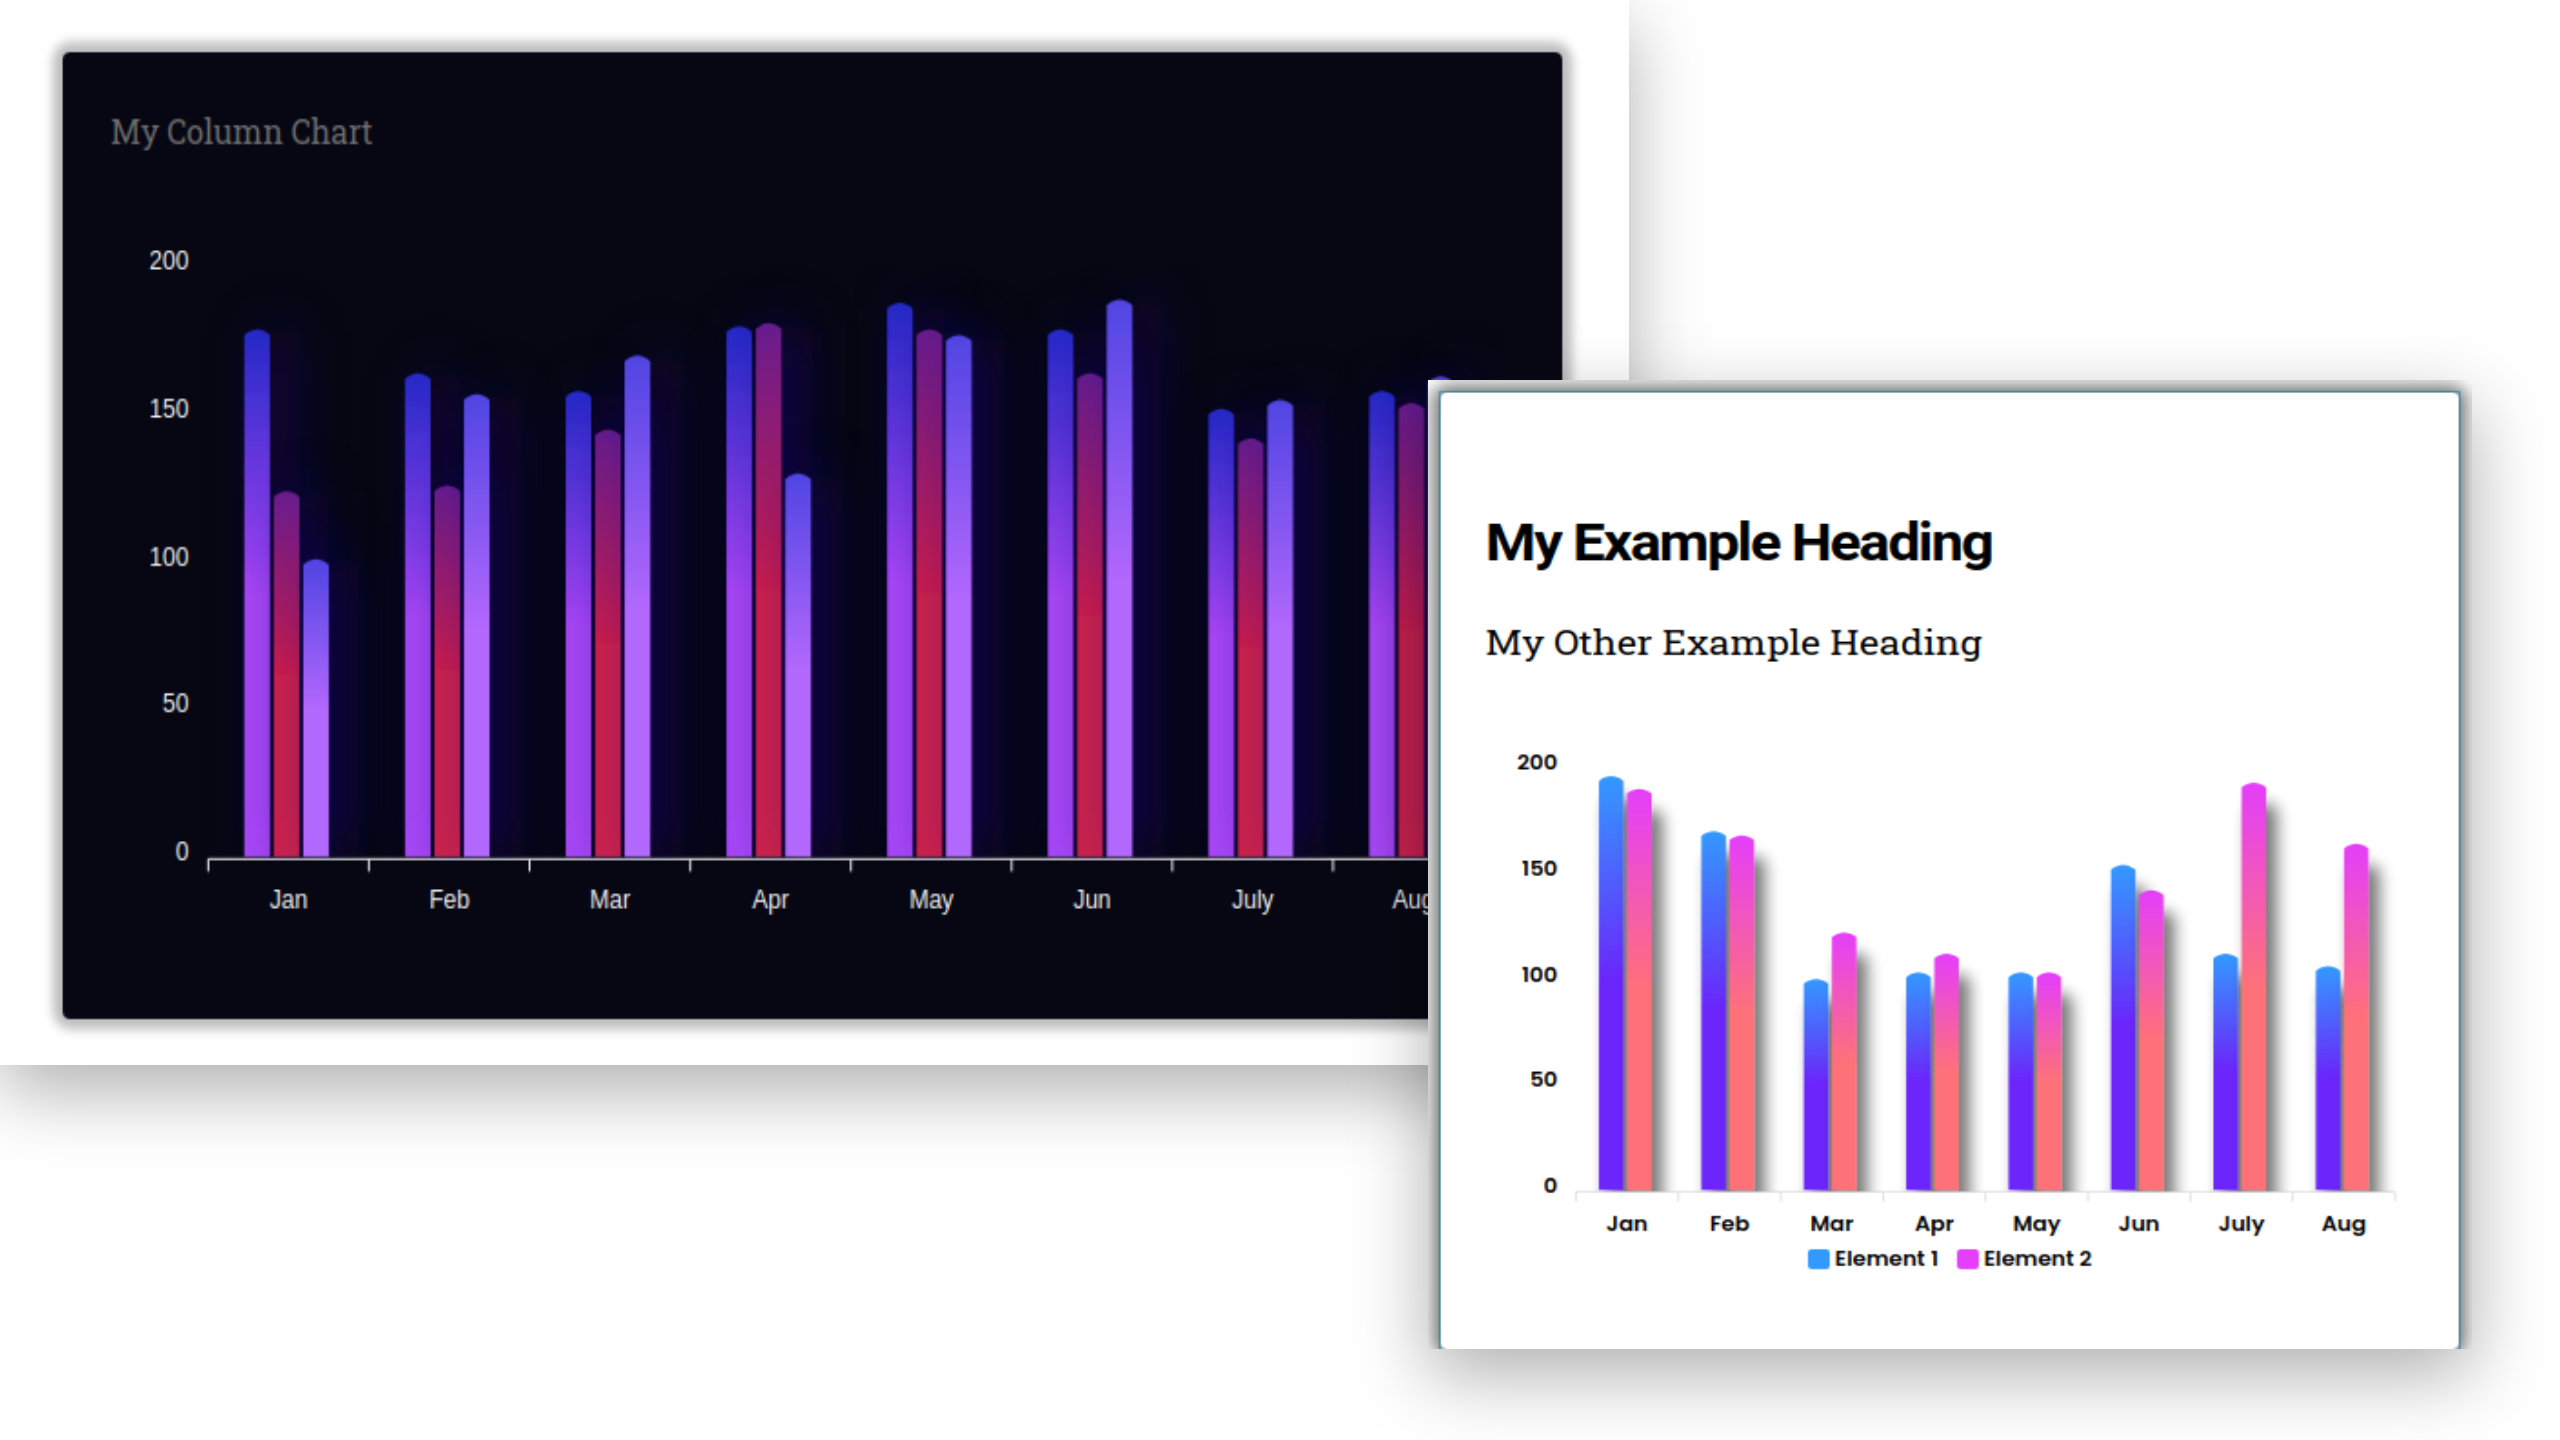
Get your best Look N' Feel 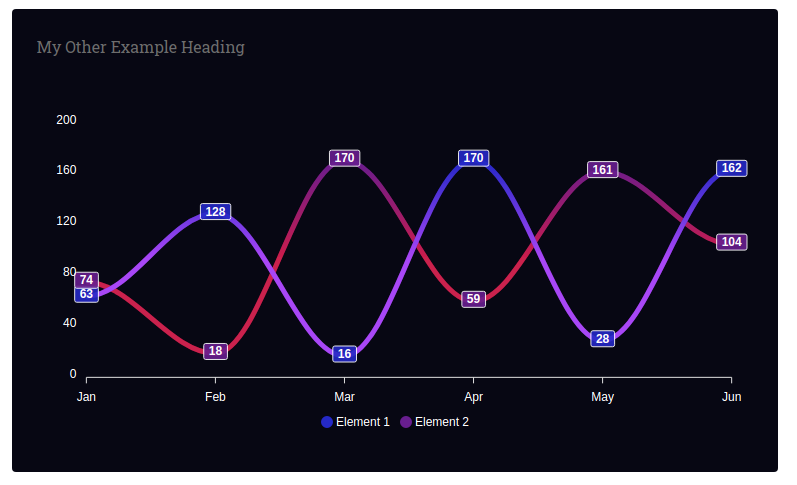
Line chart with gradient 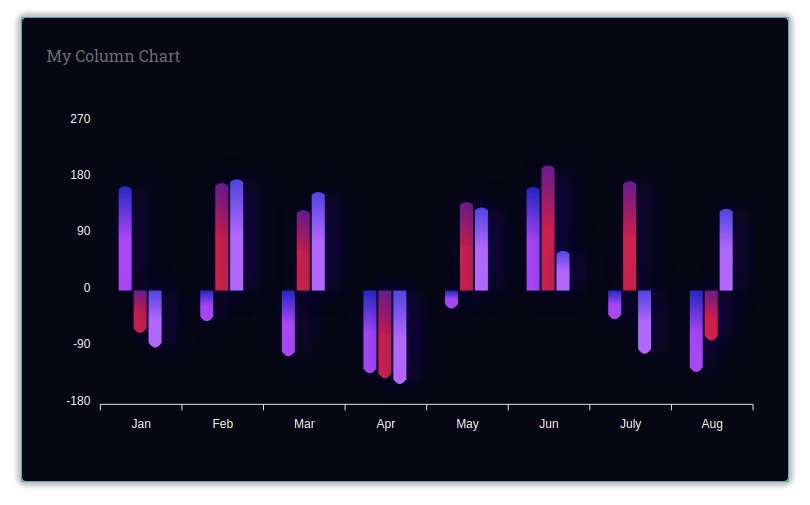
Column chart with negative value and gradient 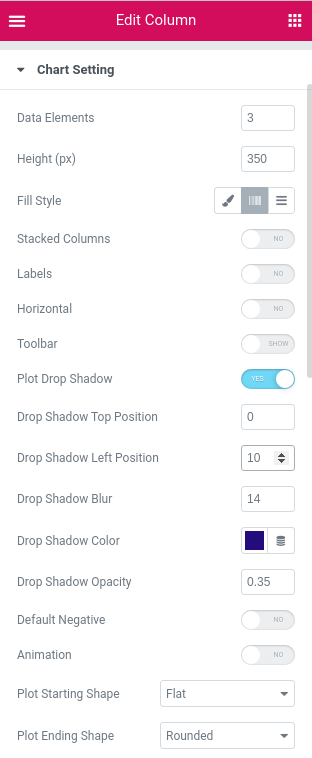
Ultimate widget options
Εγκατάσταση
- Upload the plugin and activate it (alternatively, install through the WP admin console)
- Edit any page/post using edit with elementor option
- On elementor widget menu, search/scroll and find the Graphina Charts Addon
- Drag and drop this addon, where you have to add the section
- Customize the options and add the content
- Hurray! in a minute you have added the Image Hover Section
Συχνές Ερωτήσεις
-
Can I use the plugin without Elementor Page Builder?
-
No. You cannot use without Elementor since it’s an addon for Elementor.
-
Does it work with any theme?
-
Of course, you can use it with any theme which supports Elementor.
-
What if I upgrade to PRO version?
-
All your existing charts and graphs remains intact + new PRO options are enables for those charts.
-
Which Chart Library used in Graphina?
-
We have built this using Apex charts, Google visualization, Jquery-datatable and D3 js.
-
Can I suggest/request a chart or graph to be added?
-
Yes, we’d love to hear from you at hello@iqonic.design.
Κριτικές
Συνεισφέροντες & Προγραμματιστές
“Graphina – Elementor Charts and Graphs” είναι λογισμικό ανοιχτού κώδικα. Οι παρακάτω έχουν συνεισφέρει στη δημιουργία του.
ΣυντελεστέςΜεταφράστε το “Graphina – Elementor Charts and Graphs” στην γλώσσα σας.
Ενδιαφέρεστε για την ανάπτυξη;
Περιηγηθείτε στον κώδικα, ανατρέξτε στο αποθετήριο SVN ή εγγραφείτε στο αρχείο καταγραφής αλλαγών ανάπτυξης μέσω RSS .
Σύνοψη αλλαγών
1.8.9 – 1/03/2024
- Bug fix
1.8.8 – 18/11/2023
- Bug fix
1.8.7 – 18/11/2023
- WordPress version 6.4 compatible
- Elementor version 3.17 compatible
- [Update] Apexcharts Library
- Bug fix
1.8.6 – 28/08/2023
- WordPress version 6.3 compatible
- Bug fix
1.8.5 – 15/03/2023
- Bug fix
1.8.4 – 21/02/2023
- dynamic data bug sort
1.8.3 – 17/02/2023
- minor bug sort
1.8.2 – 17/01/2023
- heading and subheading bug sort
1.8.1 – 17/01/2023
- tooltip shared issue sort
- minor bugs sort
1.8.0 – 13/01/2023
- php 8 support
- dynamic chart id
- format in horizontal chart
- datatable data fetch from ajax
- code optimize
1.7.9 – 12/10/2022
- Minor bug sort
1.7.8 – 27/09/2022
- Column horizontal chart prefix and postfix issue sort
- Minor bug sort
1.7.7 – 27/07/2022
- forminator percentage wise data
- minor bugs sort
1.7.6 – 20/07/2022
- color bug sort
1.7.5 – 20/07/2022
- apexchart js update
- jquery functions update
- csv and png export in apexcharts bugs sort
- thousand seperator changes
- dynamic change chart type in googlecharts
- jquery datatable new style section
- timeline chart hide or show datalabels
- minor bugs sort in googlecharts
1.7.4 – 24/05/2022
- script bug sort
1.7.3 – 12/05/2022
- chart wise script load
- minor bug sort
1.7.2 – 12/05/2022
- elementor version 3.6.5 compatibility
- minor bug sort
- prefix and postfix in google pie/donut charts
1.7.1 – 25/03/2022
- elementor version 3.6.1 compatibility issue fix
1.7.0 – 17/03/2022
- bug fixes
1.6.9 – 15/03/2022
- minor bug fixes
1.6.8 – 12/02/2022
- Added: google charts (line, area, bar, column, pie, donut)
1.6.7 – 01/02/2022
- minor bug fixes
1.6.6 – 31/01/2022
- minor bug fixes
1.6.5 – 29/01/2022
- minor bug fixes
1.6.4 – 29/01/2022
- minor fixes
1.6.3 – 28/01/2022
- minor fixes
1.6.2 – 27/01/2022
- dynamic change chart type
- scatter chart (new chart)
- stacked option in area n line chart
- series value in legend
- axis setting in polar setting
- prefix and postfix in circle charts tooltips value
- total value option in pie and donut chart
- large string in category (split by comma ” , ” ) example
- show or hide date or time in x-axis label ( timeline and candle chart)
- admin setting panel
1.6.1 – 27/12/2021
- minor fixes
1.6.0 – 27/12/2021
- New chart added: distributed column chart
- Allow html content in heading and subheading
- tooltip prefix and postfix in circle charts
- minor fixes
1.5.9 – 16/12/2021
- Added: Marker Option in area, line and radar chart
1.5.8 – 25/07/2021
- Added: Marker Option in area, line and radar chart
1.5.7 – 07/07/2021
- Added: Marker Option in area, line and radar chart
1.5.6 – 30/04/2021
- Bug Fixes
1.5.5 – 29/04/2021
- Bug Fixes
1.5.4 – 20/04/2021
- Added: Export file name dynamic
- Bug Fixes
1.5.3 – 24/02/2021
- Bug Fixes
1.5.2 – 09/02/2021
- Bug Fixes
1.5.1 – 06/02/2021
- Bug Fixes
1.5.0 – 05/02/2021
- Added: New options for Tooltip, X-axis and Y-axis, Y-axis 0 point indicator
- Added: SQL Builder support
- Added: ACF Data field support( Dynamic Tags )
- Bug Fixes
1.4.4 – 12/12/2020
- Bug Fixes
1.4.3 – 09/12/2020
- Bug Fixes
1.4.2 – 02/12/2020
- Bug Fixes
1.4.1 – 01/12/2020
- Bug Fixes
1.4.0 – 24/11/2020
- Added: New options for X-axis and Y-axis
1.3.0 – 21/10/2020
- Minor Bug Fixes
1.2.0 – 21/09/2020
- Add pro dynamic data
1.1.1 – 04/09/2020
- Bug Fixes
1.1.0 – 08/08/2020
- Added: New Options in bubble, candle and timeline chart
- Minor Bug Fixes
1.0.3 – 06/08/2020
- Bug Fixes
1.0.2 – 04/08/2020
- Added: Tooltip Option
- Bug Fixes
1.0.1 – 01/08/2020
- Bug Fixes
1.0.0 – 31/07/2020
- NEW: Animated Radial Chart with options
- NEW: Bubble Chart with options
- NEW: Radial Chart with options
- NEW: Candle Chart with options
- NEW: Heatmap Chart with options
- NEW: Timeline Chart with options
- NEW: Polar Chart with options
- NEW: Area with options
- Added: Advance options in all charts
- Added: Styling options
- Minor Improvements and Fixes
0.0.5 – 23/07/2020
- Initial stable release